Track a Narrative Trigger over time
💡 Follow a Trigger’s arc across a period — where it peaks, where it fades, which Assets amplify it, and which Narratives it sustains.
Narrative Pulse tracks every Narrative Trigger continuously, so you can watch one across any window you choose. Open it from the left-hand navigation in Vantage, switch to the Narrative Triggers tab, and this guide follows a single Trigger’s whole arc — where it peaks, where it fades, which Assets amplify it, and which Narratives it sustains.
When to use this
When you want the shape of a Trigger over time — building, cresting, or fading — and what is behind each turn: which Assets amplified each peak, and which Narratives the Trigger sustained. Set a wide window, a month or more, so the whole arc is visible.
KEY TERM Narrative Trigger — A cluster of trending real-world discussions or events that activates or reactivates a Narrative or Sub-Narrative in the Information Landscape, surfacing why audiences engage with the Narrative at a given moment. |
|---|
KEY TERM Malign Asset — an Asset identified by its behavior and stance. This includes Assets that display malign tactics, techniques, and procedures or coordinated inauthentic behavior; sources named in threat reports by international organizations and platforms; as well as Assets with 70% or more semantic match with narratives of datasets of attributed Malign Assets' publications. |
TIP Engagement keeps updating for a couple of days after a post appears and settles after about 48 hours, so the most recent point on a timeline may still move. For what each metric means, see Narrative Pulse — Terms & Metrics. |
The Walkthrough
Set the platform and window, then pick a Trigger
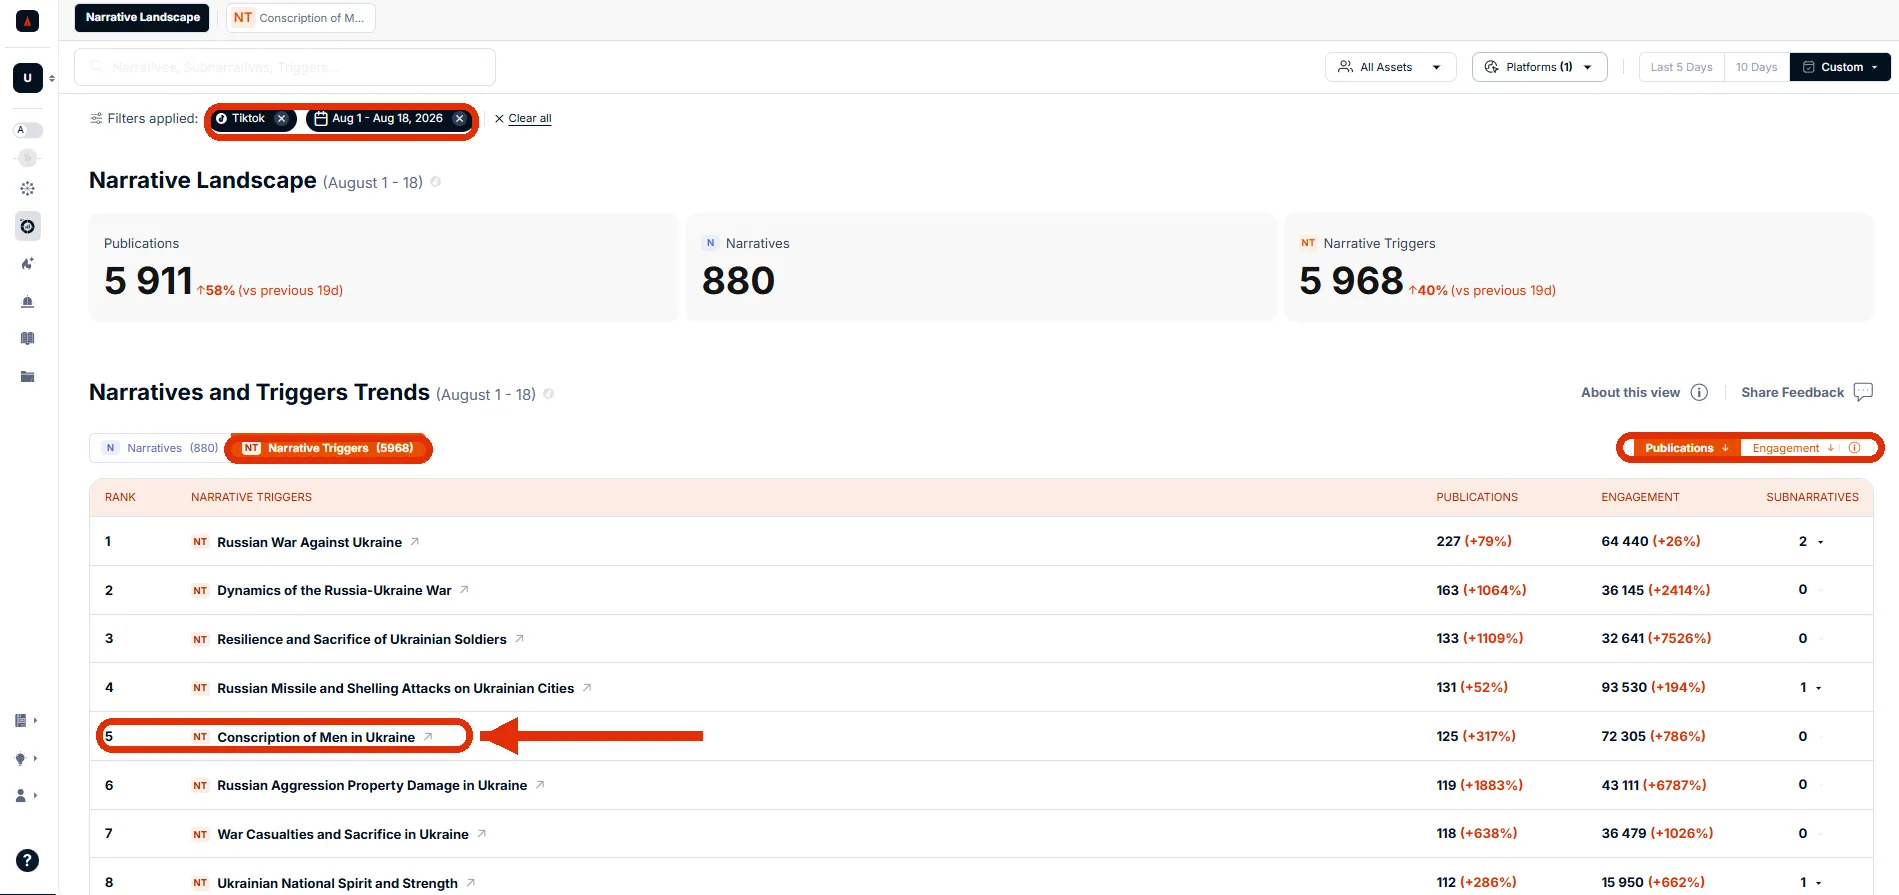
On the top panel, choose the platform and the time window. Switch to the Narrative Triggers tab and sort by Publications or Engagement. Select the Trigger that connects most directly to the narrative threats you are tracking.
Narrative Triggers filtered to one platform across a wide window, sorted by Publications. Select the Trigger most relevant to the narrative threats you are tracking.
Read its peaks by asset type — and its decline
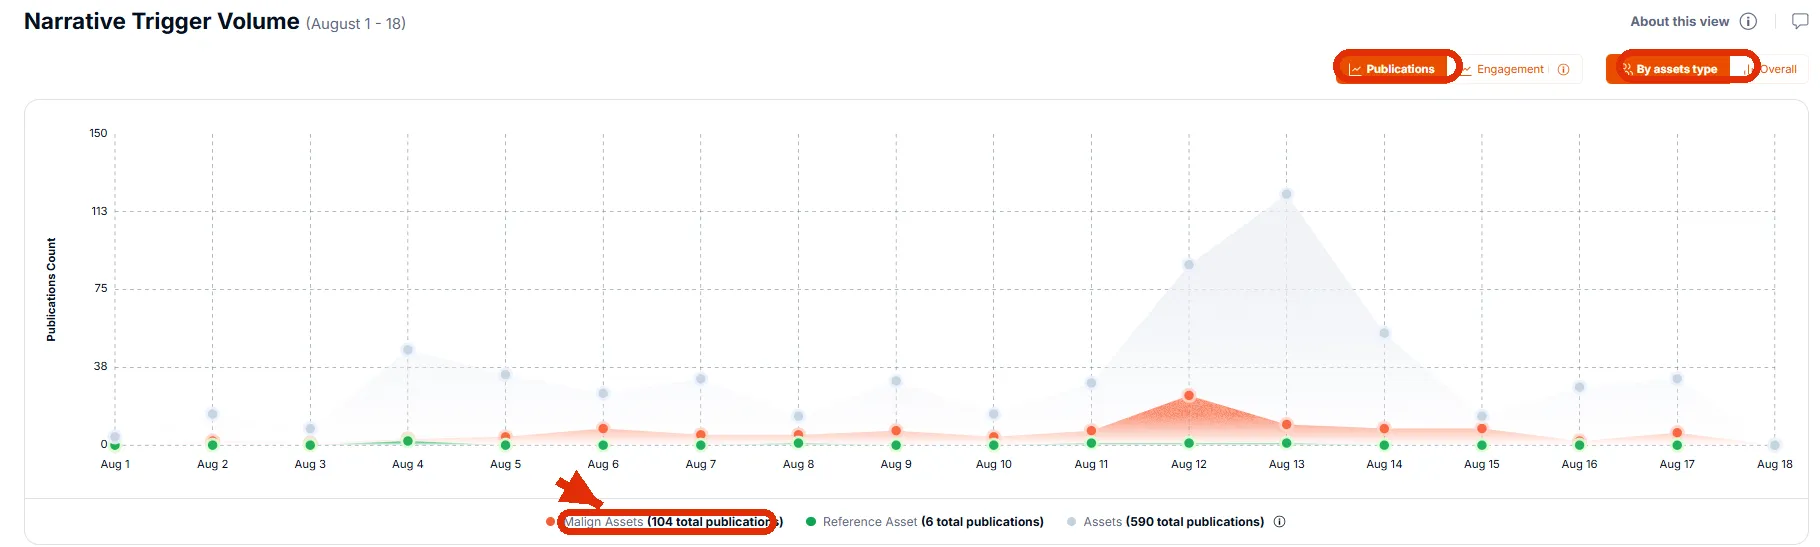
Open the Trigger. The Narrative Trigger Volume graph plots it in Publications view, broken down by asset type: Malign Assets, Reference Assets, and Assets. Read when the Trigger peaked, when it declined, and which asset type was active on each spike.
The Trigger’s arc broken down by asset type — Malign Assets, Reference Assets, and Assets each plotted separately across the period.
Toggle to compare Engagement and the overall dynamic
Use the toggles on the right of the graph to switch between Publications and Engagement, and between By assets type and Overall. Each combination reveals a different dimension of the same arc.
Check which Assets were most active
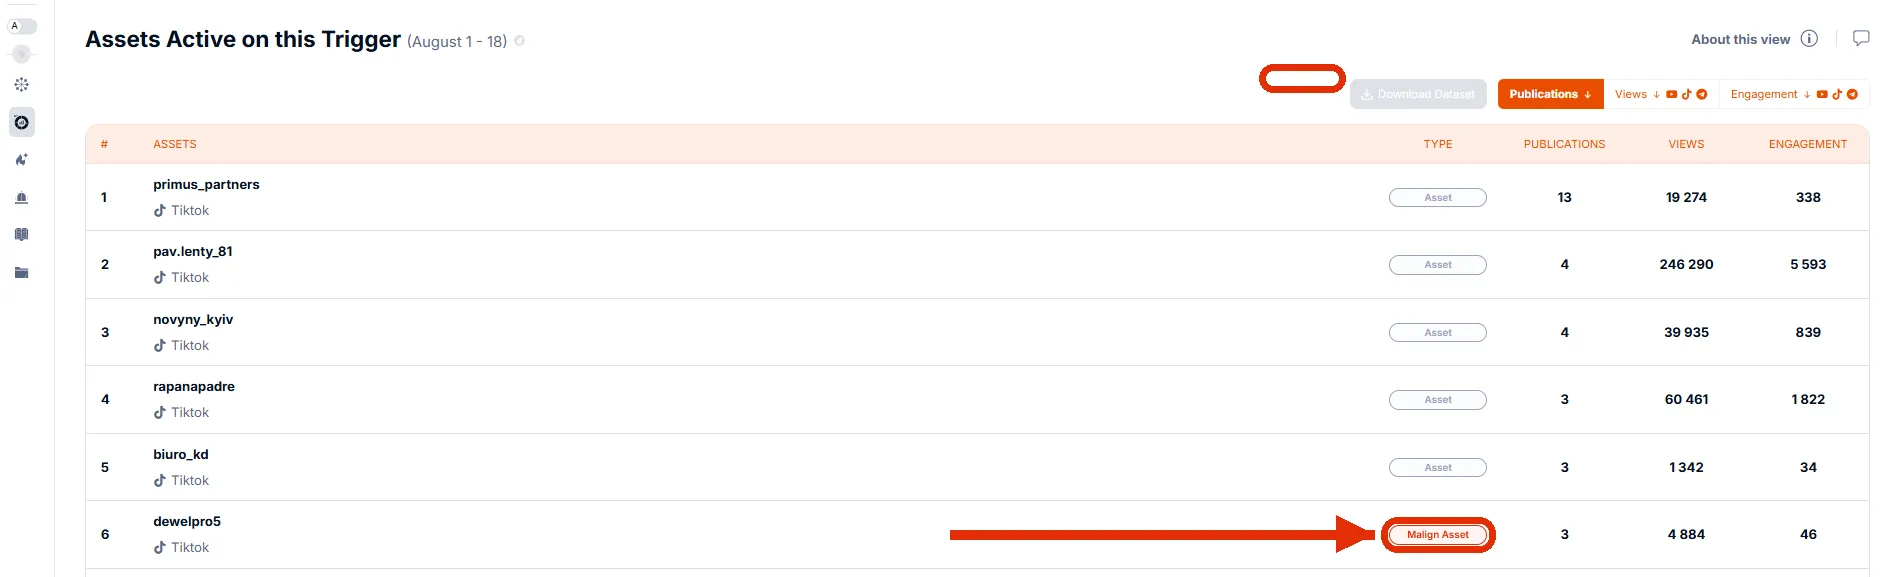
Scroll down to Assets Active on this Trigger. The table ranks every Asset that published on the Trigger across the period, sortable by Publications, Views, or Engagement. Check the Type column to identify any Malign Assets in the list.
See which Narratives this Trigger sustains
Scroll to the Narratives and Sub-Narratives Trends table at the bottom of the page. This shows the parent Narratives the Trigger has activated across the period — the structural frames it is reinforcing.

Share feedback at any point
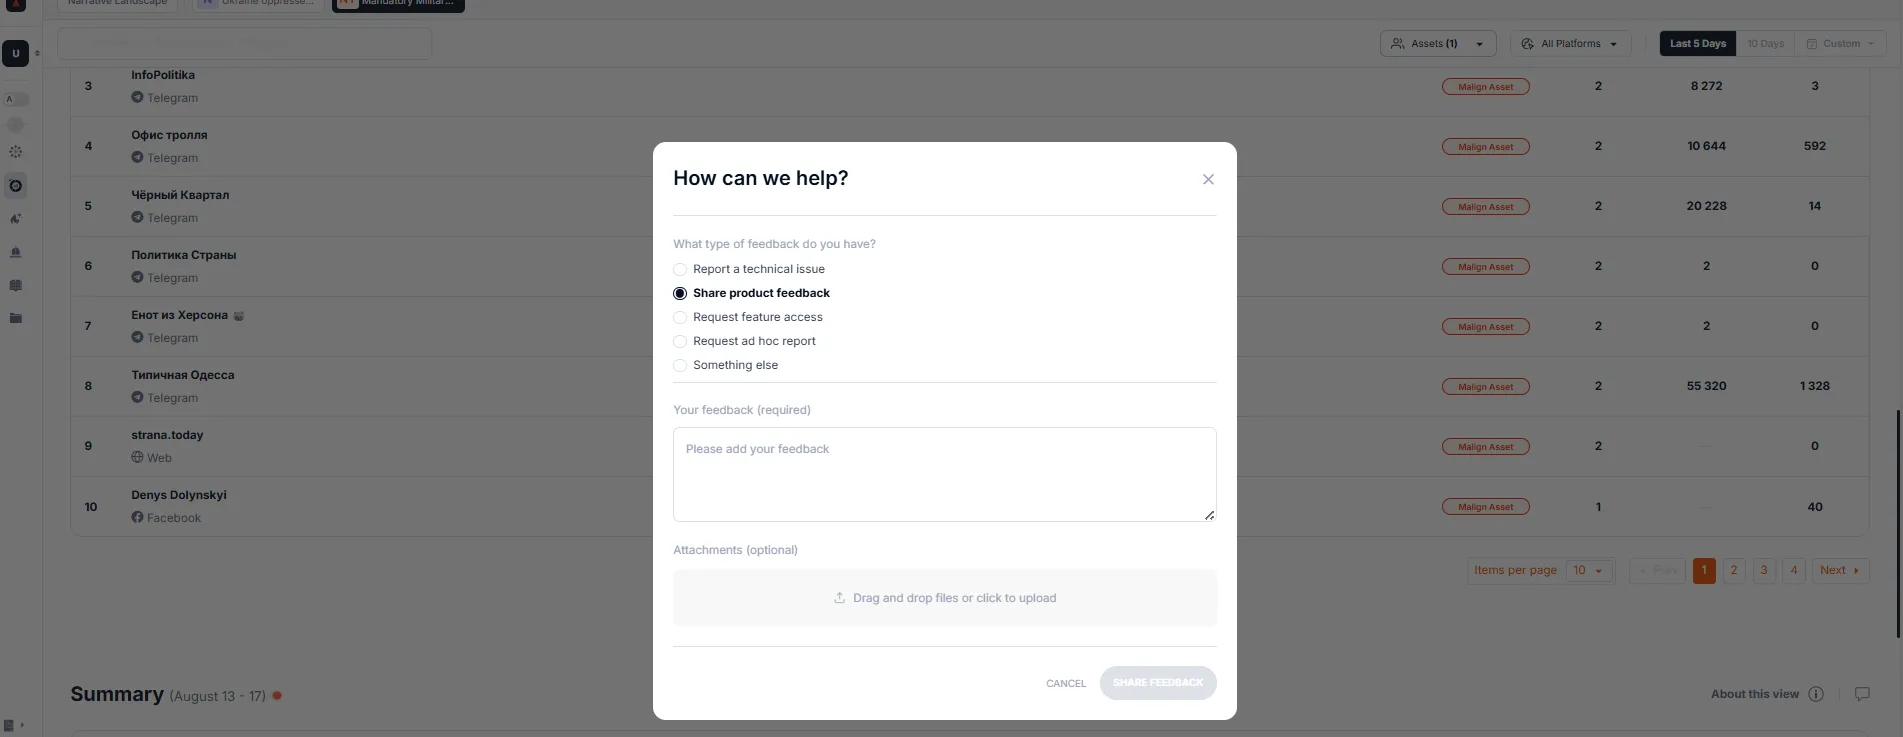
Tell us whenever something is not working or does not look right, or share what would make Narrative Pulse better for you. There are two ways in: the message icon, available throughout Narrative Pulse, and the Support button in the bottom-left corner.
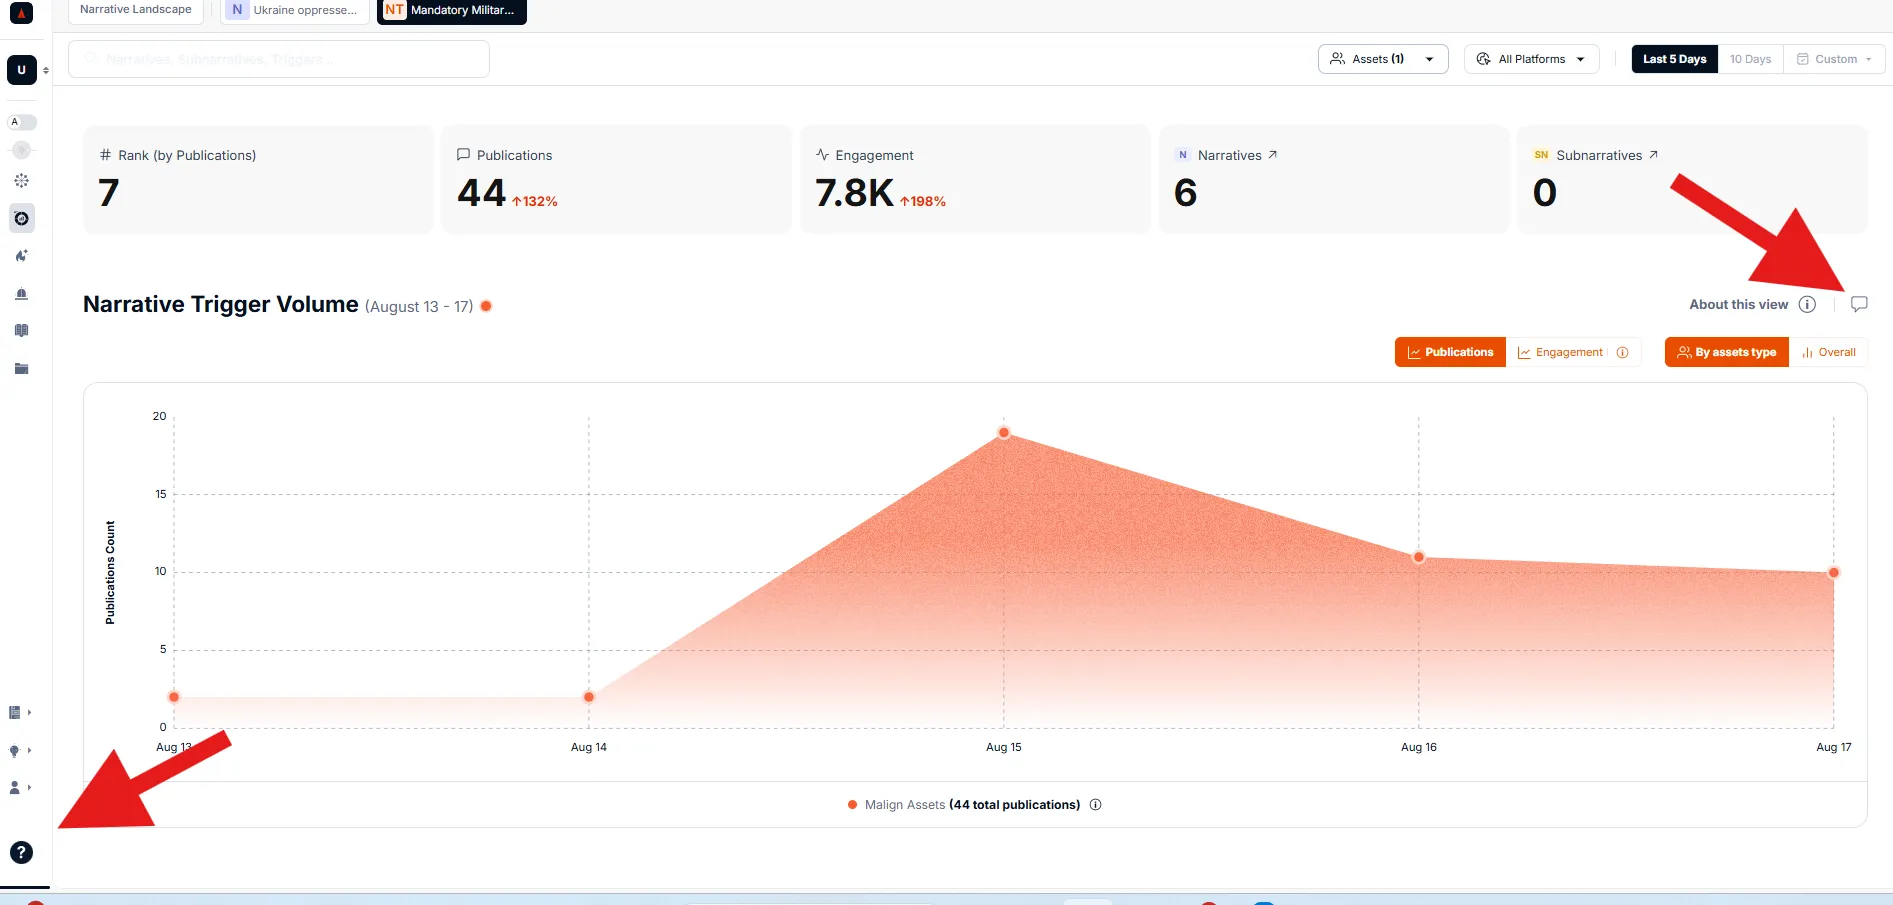
Either opens the “How can we help?” form — choose the type of feedback, add a note, and attach a file if it helps.
Have a question? Our team is ready to help via the Support form.
Last Updated: 30 August, 2026